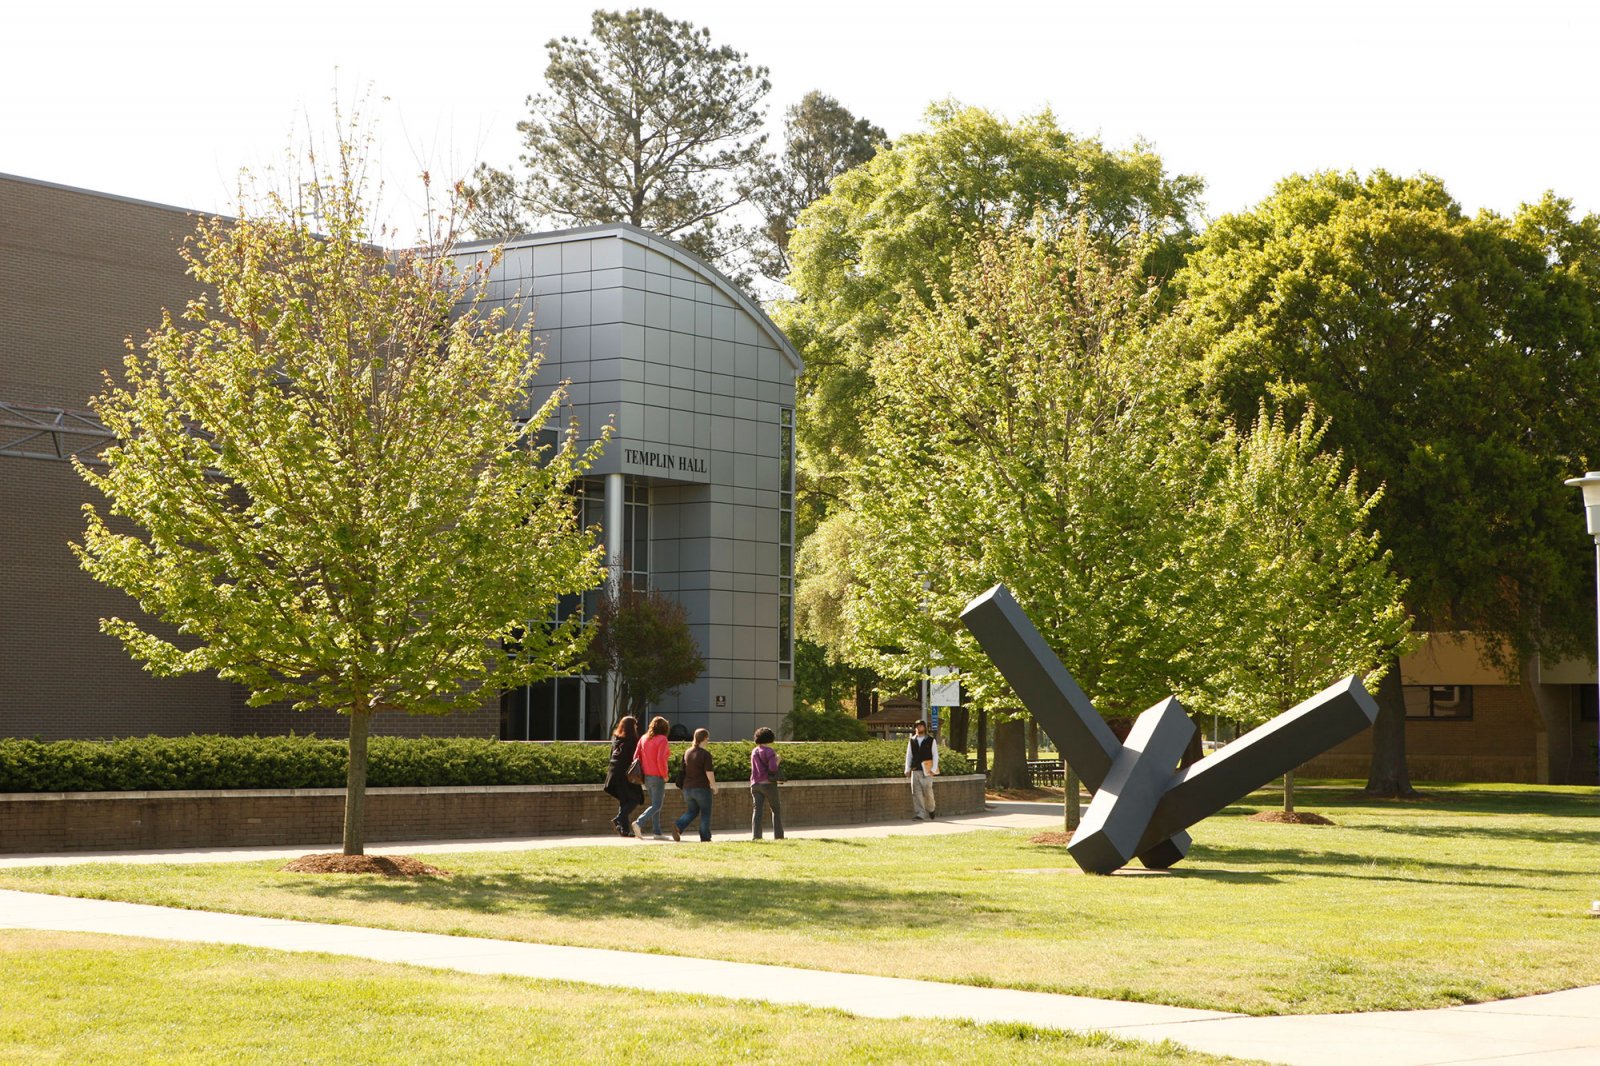
In Academic Year 2023-2024 Virginia Peninsula Community College served 9,012 students (unduplicated headcount) in credit instruction, making it the sixth largest college within the Virginia Community College System in terms of headcount.
The College serves a highly diverse region, and its student body closely reflects the demographics of the greater community. Of the College’s 9,012 credit students, 56.5% are female, 28.3% are 25 years old or older, and 52.9% are minority in terms of race/ethnicity.
Virginia Peninsula Community College serves a region that is home to many military service members and their families. In Academic Year 2023-2024 26.3% of Virginia Peninsula credit students indicated a military affiliation (e.g., active-duty, veteran, military spouse, or military dependent).
2023-2024 Enrollment Statistics
- Unduplicated Headcount 9,012
- Full time equivalency (FTES) 3,723
| Enrollment by Ethnicity | Number | Percent |
|---|---|---|
| White | 3,949 | 44% |
| Black or African American | 2,506 | 28% |
| American Indian / Alaska Native | 30 | < 1% |
| Asian | 508 | 6% |
| Native Hawaiian / Pacific Islander | 21 | < 1% |
| Hispanic / Latino | 1003 | 11% |
| Two or More Races | 696 | 8% |
| Race and Ethnicity Unknown | 299 | 3% |
| Enrollment by Age | Number | Percent |
|---|---|---|
| Under 18 | 2,280 | 25% |
| 18 - 19 | 1,948 | 22% |
| 20 - 21 | 1,280 | 14% |
| 22 - 24 | 953 | 11% |
| 25 - 29 | 877 | 10% |
| 30 - 34 | 595 | 7% |
| 35 - 39 | 415 | 5% |
| 40 - 49 | 418 | 5% |
| 50 - 64 | 223 | 2% |
| 65 and over | 23 | < 1% |
| Enrollment by Gender | Number | Percent |
|---|---|---|
| Male | 3,693 | 41% |
| Female | 5,092 | 57% |
| Unknown | 227 | 3% |
| Enrollment by Program | Number | Percent |
|---|---|---|
| College Transfer | 3,846 | 43% |
| Occupational / Technical | 1,697 | 19% |
| Non-Curricular | 3,469 | 38% |
| Enrollment by Residency | Number | Percent |
|---|---|---|
| Hampton | 2,110 | 23% |
| James City County | 746 | 8% |
| Newport News | 1,924 | 21% |
| Poquoson | 248 | 3% |
| Williamsburg | 717 | 8% |
| York County | 1,284 | 14% |
| Outside Service Area | 1,983 | 22% |

